Using collectd for Exim stats
I like graphing things; I find it’s a good way to look for abnormal patterns or try to track down the source of problems. For monitoring systems I started out with MRTG. It’s great for monitoring things via SNMP, but everything else needs some custom scripts. So at one point I moved my home network over to Munin, which is much better at graphing random bits and pieces, and coping with collecting data from remote hosts. Unfortunately it was quite heavyweight on the Thecus N2100 I was running as the central collection point at the time; data collection resulted in a lot of forking and general sluggishness. So I moved to collectd, which is written in C, relies much more on compiled plugins and doesn’t do a load of forks. It also supports a UDP based network protocol with authentication + encryption, which makes it great for running on hosts that aren’t always up - the collection point doesn’t hang around waiting for them when they’re not around.
The problem is that when it comes to things collectd doesn’t support out of the box it’s not quite so easy to get the stats - things a simple script would sort in MRTG need a bit more thought. You can go the full blown Python module route as I did for my Virgin Super Hub scripts, but that requires a bit of work. One of the things in particular I wanted to graph were stats for my mail servers and having to write a chunk of Python to do that seemed like overkill. Searching around found the Tail plugin, which follows a log file and applies regexes to look for stats. There are some examples for Exim on that page, but none were quite what I wanted. In case it’s of interest/use to anyone else, here’s what I ended up with (on Debian, of course, but I can’t see why it wouldn’t work elsewhere with minimal changes).
First I needed a new data set specification for email counts. I added this to /usr/share/collectd/types.db:
mail_count value:COUNTER:0:65535
Note if you’re logging to a remote collectd host this needs to be on both the host where the stats are collected and the one receiving the stats.
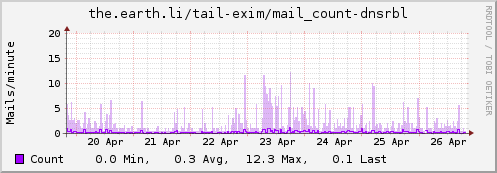
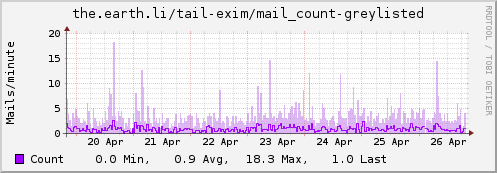
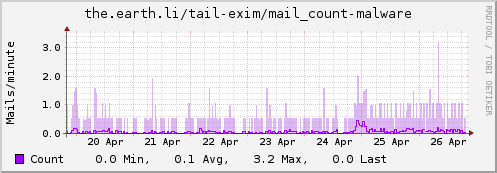
I then dropped a file in /etc/collectd/collectd.conf.d/ called exim.conf containing the following. It’ll need tweaked depending on exactly what you log, but the first 4 <Match> stanzas should be generally useful. I have some additional logging (via log_message entries in the exim.conf deny statements) that helps me track mails that get greylisted, rejected due to ClamAV or rejected due to being listed in a DNSRBL. Tailor as appropriate for your setup:
LoadPlugin tail
<Plugin tail>
<File "/var/log/exim4/mainlog">
Instance "exim"
Interval 60
<Match>
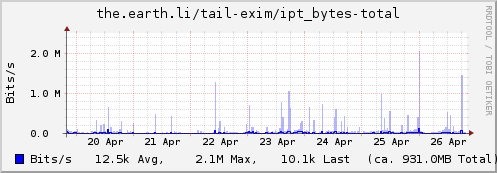
Regex "S=([1-9][0-9]*)"
DSType "CounterAdd"
Type "ipt_bytes"
Instance "total"
</Match>
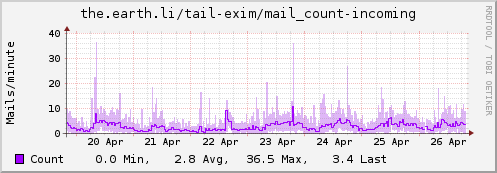
<Match>
Regex "<="
DSType "CounterInc"
Type "mail_count"
Instance "incoming"
</Match>
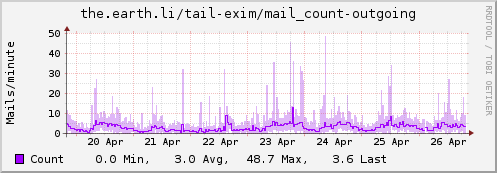
<Match>
Regex "=>"
DSType "CounterInc"
Type "mail_count"
Instance "outgoing"
</Match>
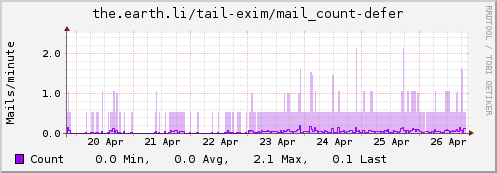
<Match>
Regex "=="
DSType "CounterInc"
Type "mail_count"
Instance "defer"
</Match>
<Match>
Regex ": greylisted.$"
DSType "CounterInc"
Type "mail_count"
Instance "greylisted"
</Match>
<Match>
Regex "rejected after DATA: Malware:"
DSType "CounterInc"
Type "mail_count"
Instance "malware"
</Match>
<Match>
Regex "> rejected RCPT <.* is listed at"
DSType "CounterInc"
Type "mail_count"
Instance "dnsrbl"
</Match>
</File>
</Plugin>
Finally, because my mail servers are low volume these days, I added a scaling filter to give me emails/minute rather than emails/second. This went in /etc/collectd/collectd.conf.d/filters.conf:
PreCacheChain "PreCache"
LoadPlugin match_regex
LoadPlugin target_scale

<Chain "PreCache">
    <Rule>
        <Match "regex">
            Plugin "^tail$"
            PluginInstance "^exim$"
            Type "^mail_count$"
            Invert false
        </Match>
        <Target "scale">
            Factor 60
        </Target>
    </Rule>
</Chain>
Update: Some examples…